Surface slip associated with the 2014 South Napa, California earthquake measured on alinement arrays
Surface slip associated with the 2014 South Napa, California earthquake measured on alinement arrays
Abstract:
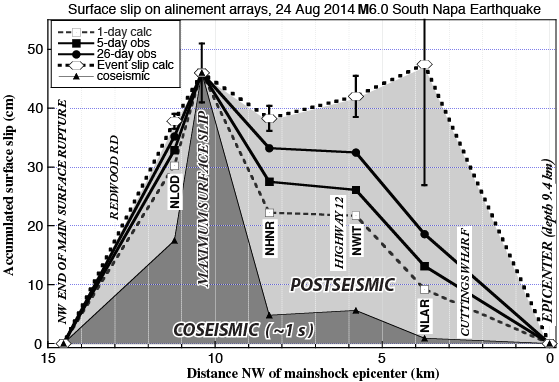
The main rupture associated with the South Napa earthquake of Sept. 24, 2014 was ~15 km long from its epicenter (defined here as km 0, see figure below) to the surface rupture’s north end (~km 15). Near km 10 a maximum of ~0.45 m dextral slip was most likely entirely coseismic, because it showed the same amount of slip at 12 days post-earthquake (d-PE) as it did at 1.5 d-PE. However, farther south (km~6) by 1-2 d-PE conspicuous growth of offsets on cultural features indicated high rates of afterslip (~10-20 cm/day) had occurred. Although afterslip is gradually slowing, it is expected to continue for many months or possibly years. To closely monitor this rapid afterslip, we installed four 70-140-m-long alinement arrays across the main rupture (labeled NLAR-NLOD on figure below), measuring slip to millimeter accuracy. A fifth array that spans a northeastern branch rupture has shown no afterslip. We have run early observations (to 26-d-PE) of afterslip (coupled with accumulated total slip as measured on adjacent offset cultural features) in the program AFTER (Boatwright et al., 1989). This analysis allows us to make preliminary estimates of initial (1 d-PE), final or total accumulated event slip, and coseismic estimates (i.e., projecting slip toward a ~0.5-1 s rise time). Thus far modeled slip on all four arrays indicates that final values of total (coseismic plus post-seismic) slip might be approaching the maximum coseismic slip as a limit (~0.4 ± 0.1 m). The final values of total surface slip may thus become more uniform along the fault over time as compared to modeled heterogeneous seismic slip at depth. The timing of the surface slip release differs strikingly from south to north along the 2014 rupture; AFTER models suggest that slip south of the location of maximum slip (km 0-10) appears to have been dominantly postseismic (~50-100%), whereas north of the maximum slip (km 10-15) slip was mainly coseismic (~50-100%). The current AFTER model predicts that as surface slip along the fault approaches final values of total slip associated with this earthquake (e.g., ≥1000 d-PE), the respective contributions to the total event surface slip integrated along the entire fault will approach being 27% coseismic slip and 73% postseismic slip.
. . .