Studying Nearshore Ocean Waves Using X-Band Radar
Abstract:
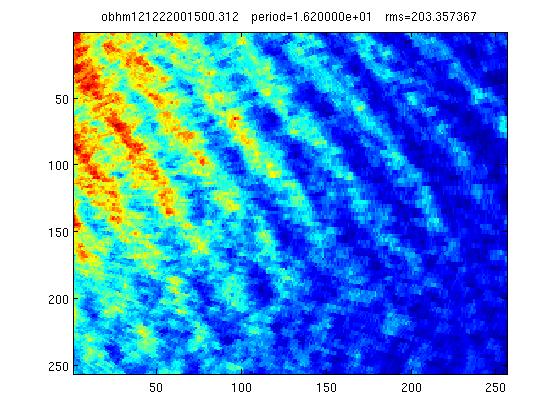
In 2011 an x-band radar system was installed on a site near the erosion hot spot, at an elevation of 13 m above low tide, about 40 m back from the high-tide line. The radar system collects images of wave crests out to 3 km from the scanner. Study of these images when offshore buoys report a single NW swell shows two swell patterns arriving at Ocean Beach, separated in direction by about 30 degrees, and producing a quilted interference pattern, as seen in the accompanying figure. We interpret these swells as following two different paths around the Bar. Preliminary ray-tracing studies tend to confirm this interpretation.
To enhance these images we have employed two techniques. The first technique, which is concerned with identification and visualization of swells in the region of interest, involves iteration over possible swell periods: scans taken at integral multiples of a given period are added together, with the sharpest image determining the swell period (see figure) and providing an enhanced image for further analysis. The second technique involves displacement of images in time by phase incrementation in k-space, with subsequent addition of images.
We will present results concerning the stability of the relative phase of the two swells, and the applicability to models for propagation of waves. Establishment of a tested propagation model would permit prediction of erosion hazards for hypothetical enhanced storms and rising sea level due to global climate change.