ARIOS: An Acidification Ocean Data Base in the Galician Upwelling Ecosystem
Abstract:
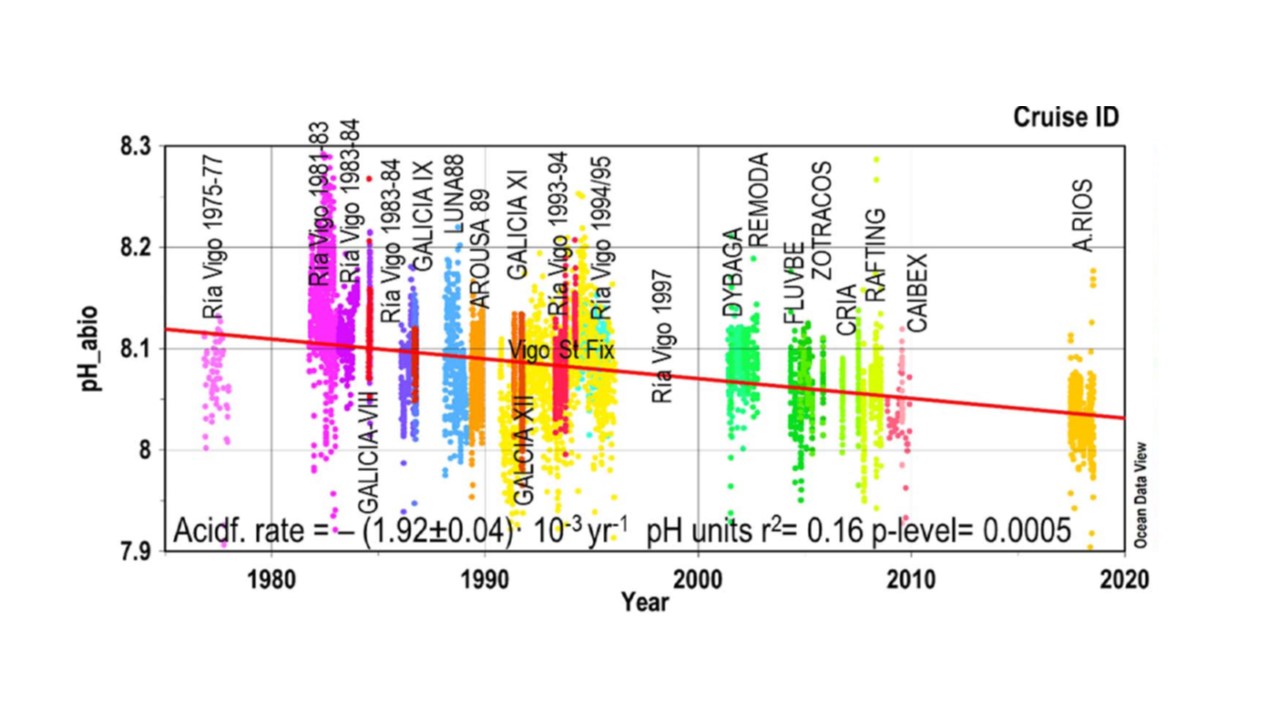
The 4300 surface pH measures (depth <7 m) correlate mainly with the biogeochemical variables (nutrients and O2) together explaining more than 66% of the pH variance, and together with the temperature 77% of the variance of the [exCO3=] (concentration of carbonate ion over its saturation value). Once the biogeochemical variability is removed, an acidification trend of -1.47 ± 0.09 ·10-3 of pH yr-1 is revealed (p-level <0.008 n = 4300). Seasonally, the variation of this trend shows a bias with trends of -2.13 ± 0.19 ·10-3 of pH yr-1 (p-level <0.05 n = 530) with spring data, while the fall trend obtained is -1.18 ± 0.15 ·10-3 of pH yr-1 (p-level<0.034 n = 1258). In the coastal zone (bottom depth <70 m) acidification is slightly higher [-1.61 ± 0.11 ·10-3 of pH yr-1, p-level<0.005 n = 3627] than in the open sea (bottom depth > 70 m) [-1.15 ± 0.11 ·10-3 of pH yr-1, p-level <0.01 n = 673]. The [exCO3=] also shows a decreasing trends of [-0.50 ± 0.03 µM·yr-1, p-level<0.005] and [-0.31 ± 0.04 µM·yr-1, p-level<0.01] in the coastal region and open sea, respectively. In addition, through the numerical techniques of neural networks, the pH variability observed in these 22 chemical databases has been projected into a weekly recorded database of physicochemical variables (INTECMAR) from 1992 to 2018. Independent data showed how the seasonal variability derived from the neural network highly correlates with those of the measured pH data and allows having a robust weekly time series to assess the variability of the pH for almost three decades.