Observations and modeling of the horizontal evolution and intertidal variability of a tidal intrusion front
David Honegger, US Army Corps of Engineers, Fort Wainwright, United States, Malcolm E Scully, Woods Hole Oceanographic Institution, Woods Hole, MA, United States, Merrick C Haller, Oregon State University, Civil and Construction Engineering, Corvallis, OR, United States, Randall Pittman, Oregon State University, School of Civil and Construction Engineering, Corvallis, United States, Annika O'Dea, US Army Engineer Research and Development Center, Duck, United States and Alexandra J Simpson, Oregon State University, Civil & Construction Engineering, Corvallis, OR, United States
Abstract:
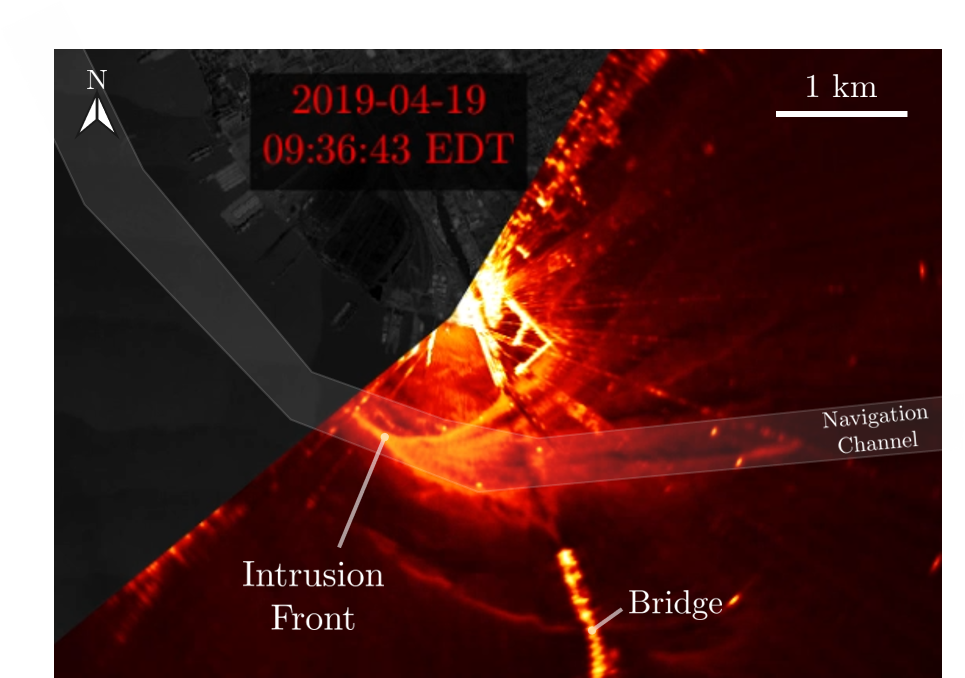
Intrusion fronts occur in lower estuaries during flood tide, as intruding dense ocean water arrests buoyant outflow at the surface and advances upchannel. In the lower James River estuary, an intrusion front is often present in the vicinity of a co-located channel bend and sharp, engineered, lateral constriction. As part of the UnderSea Remote Sensing (USRS) coordinated observation and modeling program, shore-based imaging X-band radar observations of this intrusion front were conducted over a three week period during April 2019. A rough sea surface with small breaking waves owing to sharp horizontal convergence at the front allowed the front to be identified in the radar imagery as a V-shaped pair of curves of enhanced backscatter intensity.
This continuous set of observations reveals the dynamically evolving horizontal structure of the front during its formation, advancement up-estuary, and eventual relaxation. In addition, the capture of 38 separate intrusion front events facilitates an evaluation of intertidal consistency and variability. For example, the curved flank of the V-shaped front at the inside of the channel bend was consistently locked at the upstream (down-estuary) end to the lateral constriction at the time of maximum deflection by the flooding flow. One kilometer from this pivot point, however, the front position at maximum deflection varied by as much as 750 m during the three week period. Numerical hindcast simulations encompassing the observation period are leveraged to investigate the roles of tidal forcing, freshwater input, and wind events on the observed horizontal variability of the front.