EchoFish - Visualizing water column sonar data
EchoFish - Visualizing water column sonar data
Abstract:
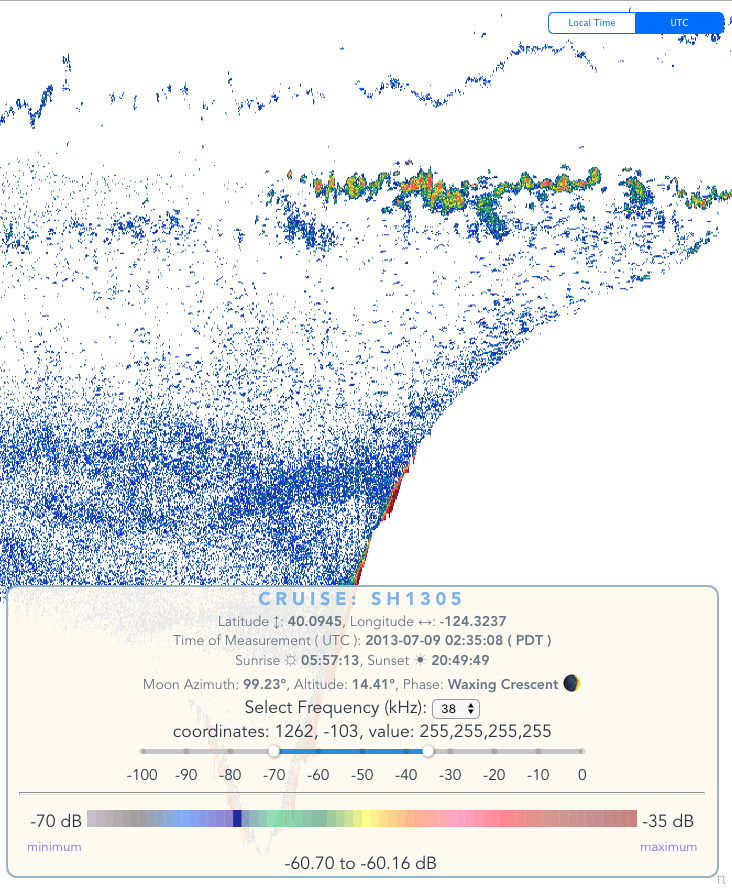
Water column sonar data have been collected for fisheries and habitat characterization over large spatial and temporal scales around the world. Over 100 TB of these data are archived at the NOAA National Centers for Environmental Information (NCEI) and made accessible through a web-based map viewer. Visualizing these complex datasets remains a challenge as the map viewer’s vessel tracklines reveal nothing of the data quality or content, and the currently generated static echograms are limited in utility. To enhance the value of the archive and expand data accessibility for public inquiry, a team at NCEI/Univ of Colorado Cooperative Institute for Research in Environmental Sciences have begun development on a portal called EchoFish where users can interactively visualize and explore the archive holdings. Initial efforts have focused on data collected from the Simrad EK60 sonar and the display of multiple frequency data in a comprehensive manner. We will discuss the current and future capabilities of EchoFish, including the automation of a data ingest pipeline hosted in a cloud environment.