Challenges of Modeling Swell Propagation and Sea Waves over a Complex Bathymetry: Implication for Coastal Flood Mapping in Sitka, AK
Challenges of Modeling Swell Propagation and Sea Waves over a Complex Bathymetry: Implication for Coastal Flood Mapping in Sitka, AK
Abstract:
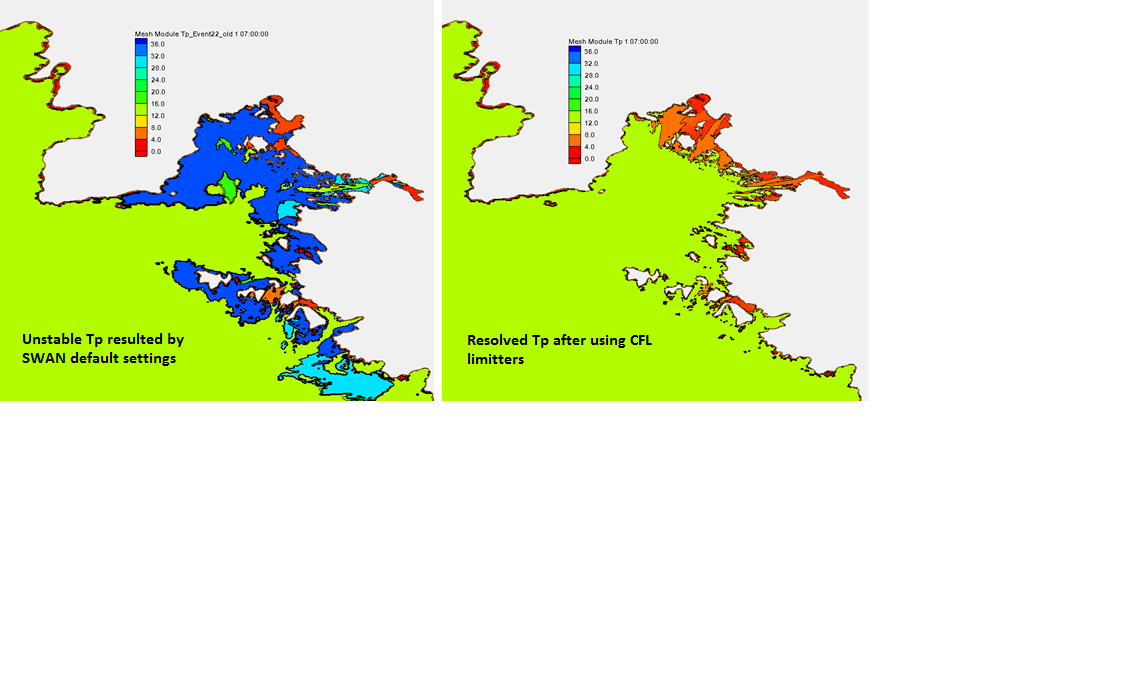
Sitka, AK is included in Region X of FEMA Flood Hazard Mapping. The scoped shoreline is located east of the Sitka Sound connecting Sitka to the Pacific waters through a semi-narrow continental shelf. Wave hindcast is a fundamental component of Coastal Flood Risk Study Process. SWAN model on an unstructured mesh was used to determine the characteristics of waves along the Sitka shoreline. This area is substantially affected by a combination of both offshore waves (swells) and waves generated by severe local winds. The bathymetry inside the Sitka Sound and the nearshore areas along the Sitka coastline is very complex and includes many abrupt deepening as a result of geological characteristics or large tidal currents. The present study provides a brief review of the steps and challenges for a reliable wave modeling over this area. The requirement for running the model in non-stationary mode in combination with the mentioned complexities initiated instabilities regarding intense refractions that cause unrealistic large values for the peak period and the wave height. Refining the computational mesh over the areas with great depth gradients as well as increasing the spectral grid resolution and decreasing time steps did not satisfactorily resolve the above issue. Choosing an appropriate CFL Limiters on Spectral Propagation Velocities in SWAN setup (which is not considered in the default settings) could properly treat this instability (See attached Figure). The model offshore boundary was prescribed using wave data obtained from the WIS buoys, while wind forcing was resulted as a combination of Sitka airport and offshore Buoy wind data. Model performance in transformation of swells from the open boundary was evaluated using two more offshore WIS buoy data. A 1D model transferred the extracted wave data from SWAN to the surfzone along each selected transect for each storm event. The the final production was runup with different recurrence periods along the shoreline.