Follow the Carbon: From Environment to Microbial Prey to Predator and from Host to Virus using SIP-Raman Microspectroscopy
Follow the Carbon: From Environment to Microbial Prey to Predator and from Host to Virus using SIP-Raman Microspectroscopy
Abstract:
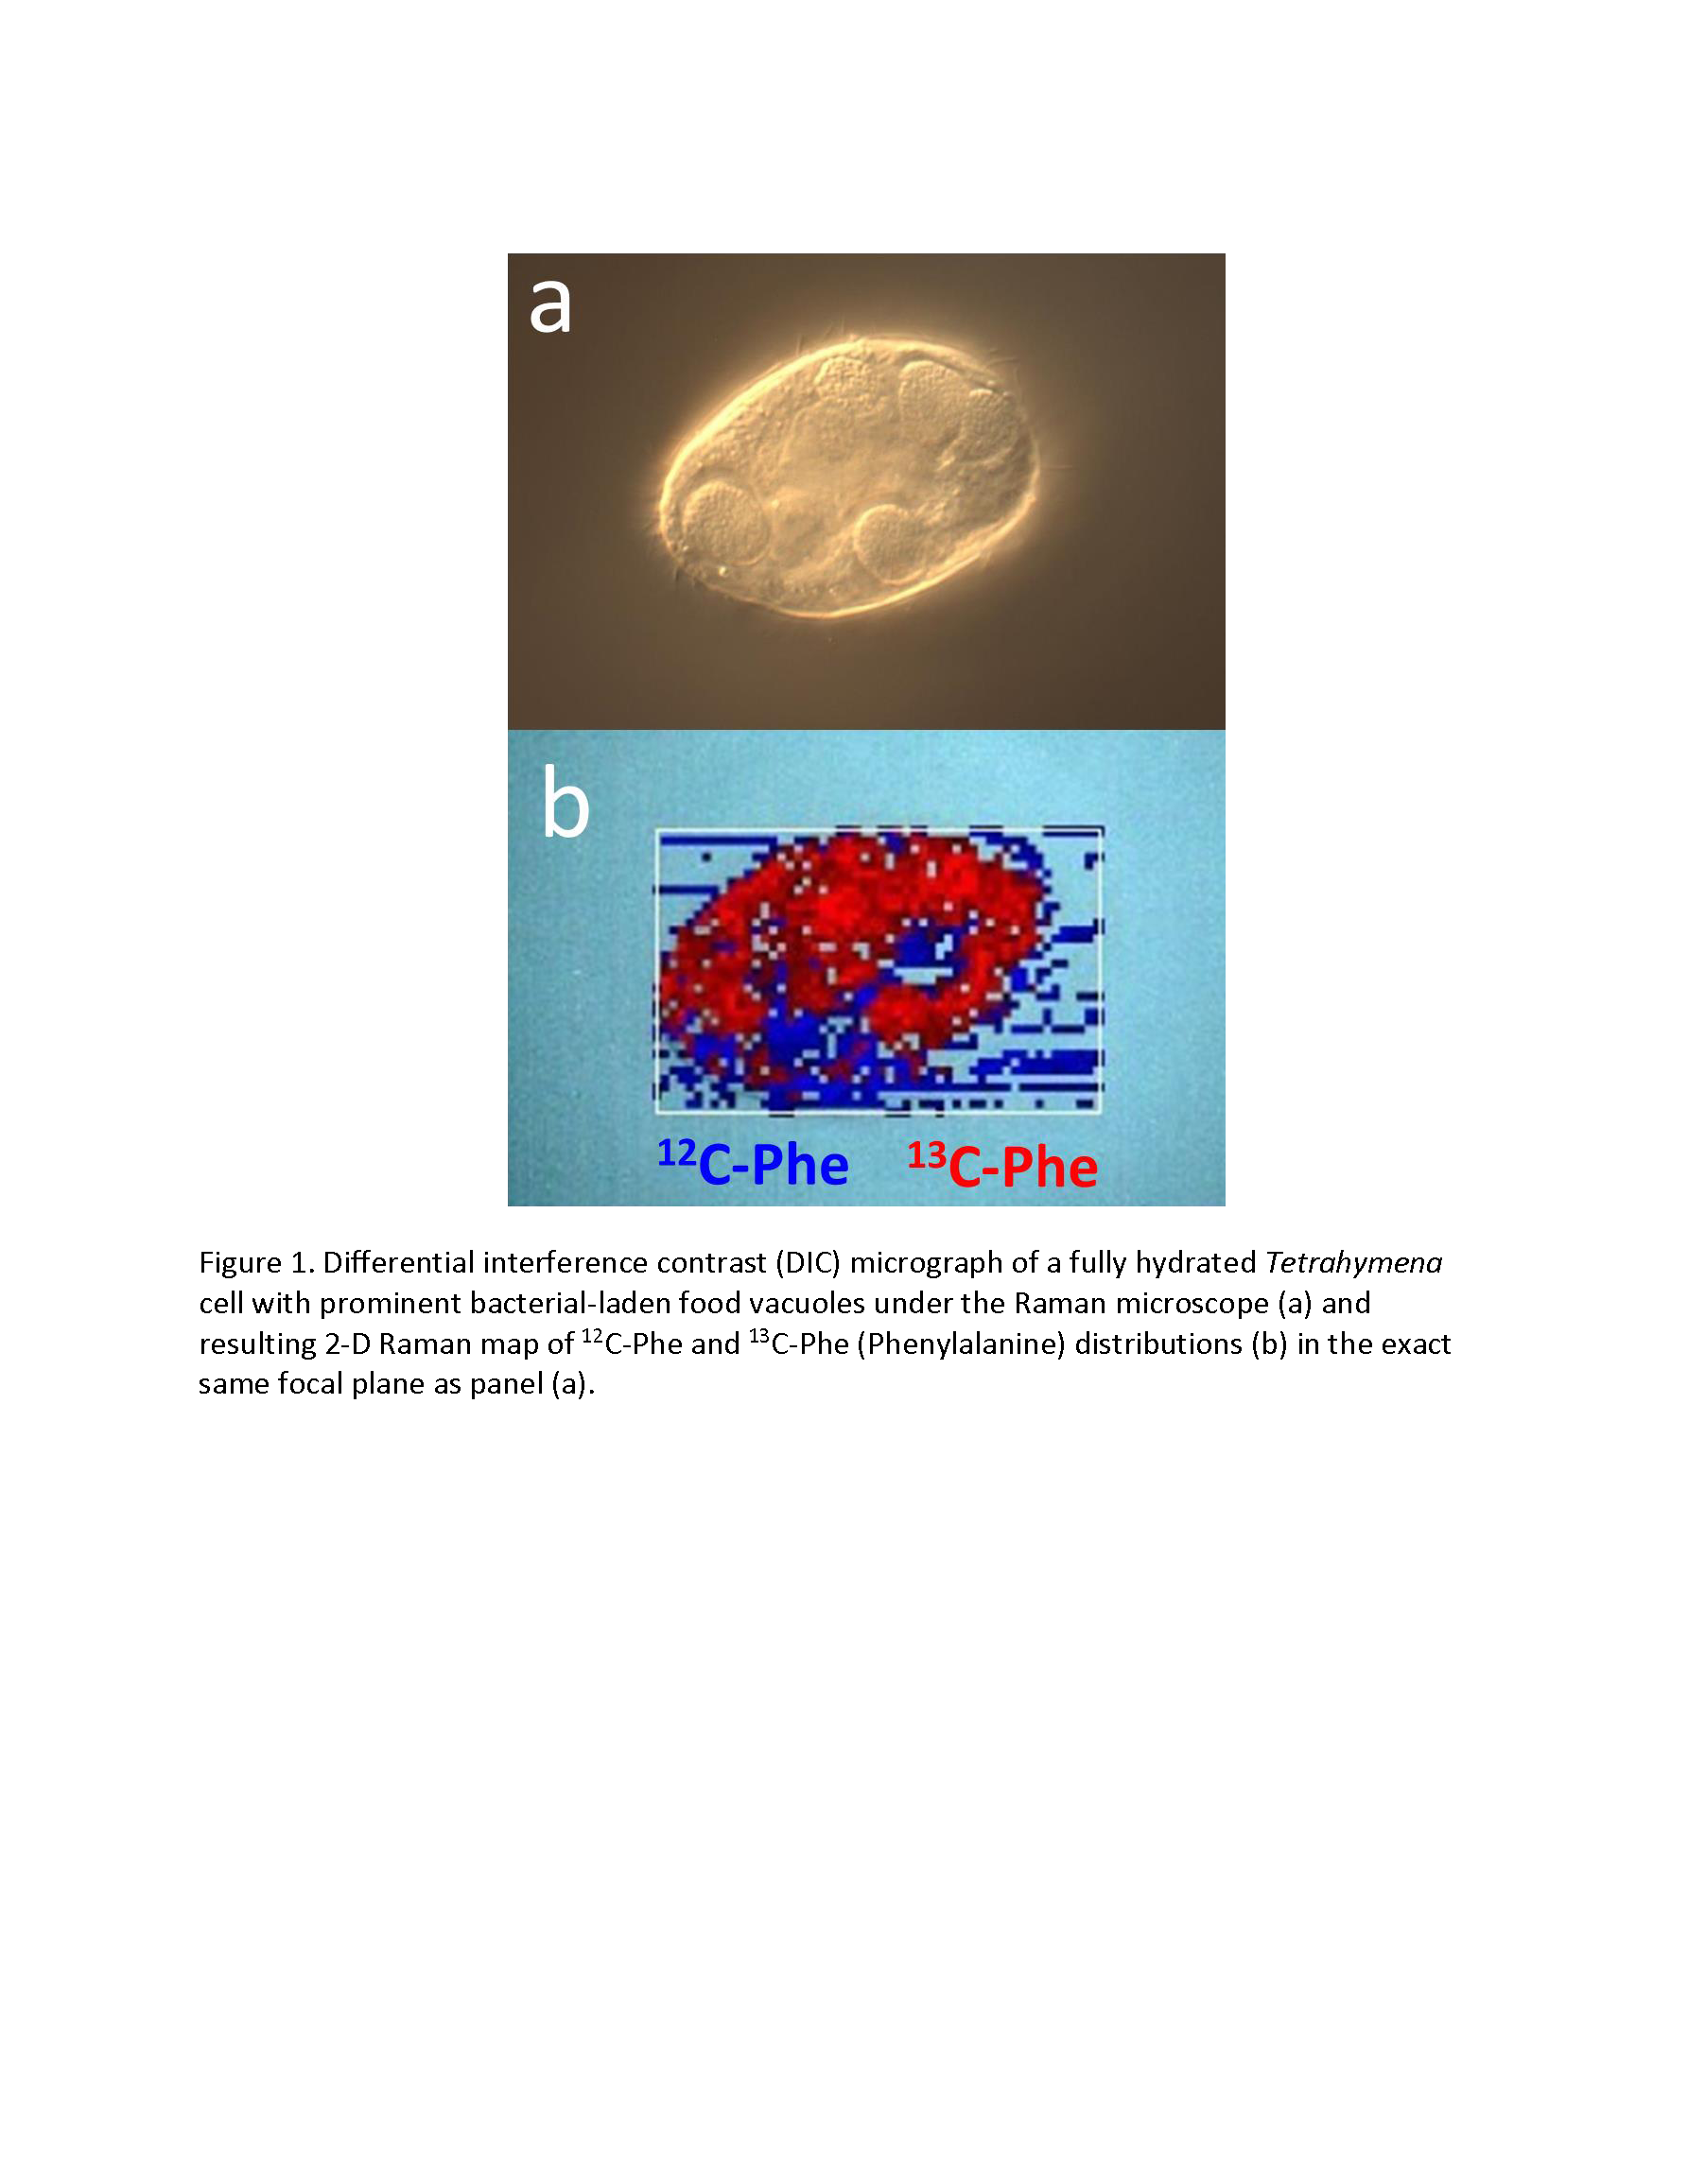
We have developed protocols that combine stable isotope probing with confocal Raman microspectroscopy (SIP-Raman) and enable single-cell measurements of carbon (13C) transfer from media to phytoplankton, bacterial prey, protistan predators and viruses. In a model system, assimilation of 13C-substrates by individual bacteria and in turn by bacterivorous ciliated protists was measured by analyzing quantitatively predictable Raman spectral shifts in cellular macromolecules. From these measurements, we can derive single-cell rates of assimilation, ingestion, and growth, as well as predator growth efficiency. Furthermore, we can spatially track intracellular propagation of 13C-labeling in two and three dimensions through time in fully-hydrated protists (Fig. 1). Essentially, the instrument serves as an intracellular mass spectrometer measuring 13C fractional abundances in 3 dimensions at 0.3-0.5 mm resolution in water-immersed cells. In the chlorophyte, Tetraselmis striata, we are able to track photosynthate stored as 13C-starch through time by 2-D Raman mapping. In SIP-Raman experiments with the Emiliania huxleyi-EhV-163 host-viral model system, we obtained single-virus Raman spectra and confirmed that EhV-163 inherits the isotopic signature of its host which may be useful in tracking free viral particles. Unexpectedly, we were also able to distinguish individual infected from uninfected E. huxleyi cells by analysis of DNA peaks in 2-D Raman maps.